
Tool for a More Equitable Distribution of Refugees in Europe
Accepting refugees can lead to long-term demographic and economic benefits for welfare states, but the initial years of residence are costly and can give rise to volatile political discourse. With few exceptions, in recent decades most European countries have attempted to shift the responsibilities of receiving refugees onto their neighbors.
What would be an equitable distribution of this responsibility? Some have highlighted a country’s size, others its wealth or rates of (un)employment. Thanks to a new cartographic tool developed by Andreas Perret – Data manager for the “nccr – on the move”, a National Centre of Competence in Research, managed by the University of Neuchâtel, which is dedicated to migration and mobility studies –and based on a study I conducted in 2014, it is now possible to choose and weight distribution criteria from the period 2008 to 2018. This tool provides a foundation for reflection which, it is hoped, will stimulate the cooperation of other countries.
The initial series of maps allows a comparison of the number of asylum seekers received (represented by a red semicircle) with an “equitable” number in proportion to given criteria (represented by a grey semicircle).
Click on the image for interactive access
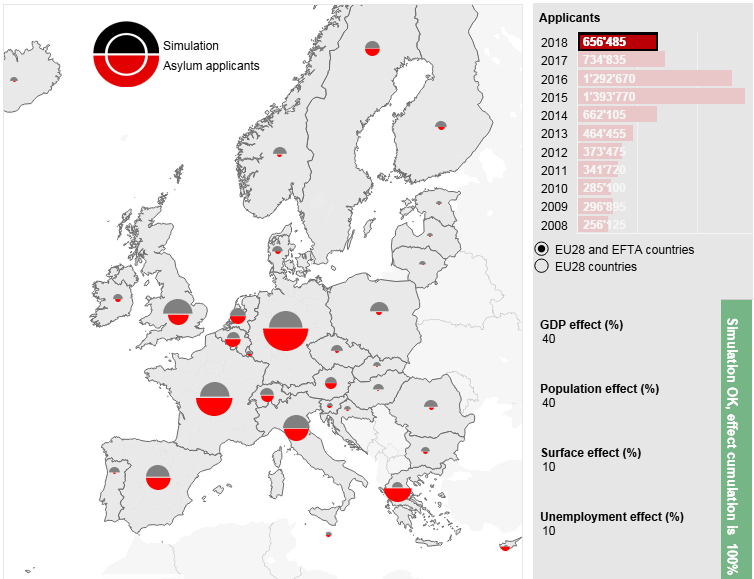
In this way, taking into account its population in 2018 (1.6% of EU + EFTA countries), Switzerland received “too many” asylum seekers (2.3%, or 15,160 instead of 10,386), as did Germany, Luxembourg, Belgium, France, Sweden, and especially Greece (66,965 instead of 13,615!), while Portugal, Norway, Denmark, the United Kingdom, and many eastern EU countries did not receive “enough”. On the other hand, considering its gross domestic product (GDP), which is 3.72% of that of the EU, Switzerland would have had to accept a significantly higher number of refugees (24,418). The same simulations can be performed based on geographic area, unemployment rate (inverse proportion), or a combination of criteria. If we adopt the weighting suggested in a report by the Mercator Foundation (Angenendt et al. 2013), i.e. 40% for GDP and population and 10% for employment rates and geographic area, we observe that Switzerland received a relatively high proportion of asylum seekers in 2017 and 2018. In 2016, however, in the midst of the Syrian refugee crisis, it should have processed more applications, especially in comparison with Germany.
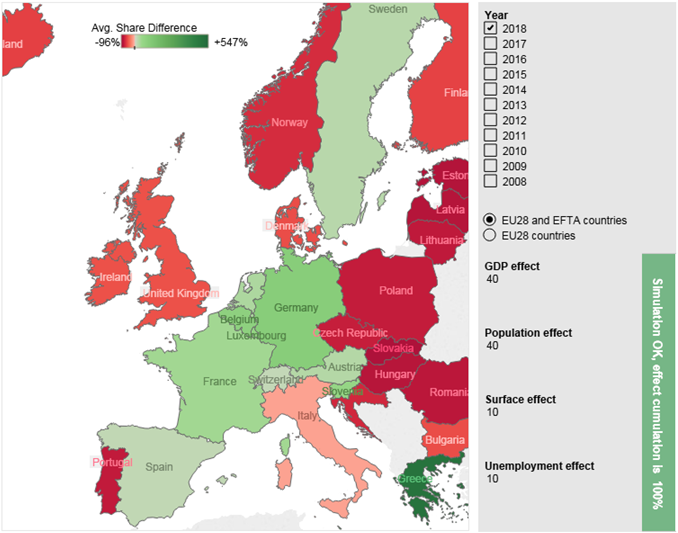
Informed Political Debate Using Cartographic Simulations
The second series of maps (Choropleth) makes it possible to identify at a glance which countries should receive more (red) or fewer (green) asylum seekers.
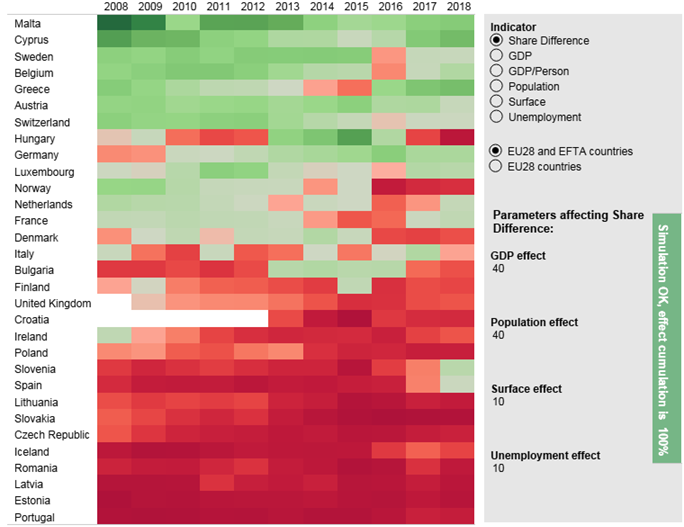
A summary table (Heat) allows us to follow developments between 2008 and 2018. Using the Mercator weighting, it becomes apparent that if some countries are chronically “unwelcoming” (eastern European countries, Portugal, Spain, Ireland, Luxembourg, the United Kingdom), others (such as Switzerland, Greece, and France) alternated between periods of openness and closure. Germany, Sweden, Austria, and Belgium have been the most regularly accommodating.
Maps do not provide direct answers to the question of “fair” distribution, nor do they provide answers to questions of which criteria should be used or the total number of asylum seekers who should be accommodated. However, by facilitating these simulations, they can inform political discourse aimed at advancing the necessary harmonization of refugee acceptance policies across Europe.
Note: Step-by-step example to create a map: In the “symbolic” pane, select the year 2018 and assign a weight of 100% to geographic area. The resulting map gives (in a red semicircle) the actual number of requests for asylum received by a country and (in grey) the number that it should have received given its size in relation to the total geographic area of the EU. France (11% of the EU territory) should have received 73,370 asylum applications (11% of the total) but actually received 119,190 in 2018. Therefore, taking geographic area as the sole distribution key, France received “too many” asylum applications. Choosing another weighting, we can combine the effect of population, employment rates, GDP, and geographic area.
Etienne Piguet is a Professor of Geography at the University of Neuchâtel.
References:
– Angeloni, S. (2019). Improving the distribution of asylum-seekers through a multi-criteria index. European Union Politics 20 (2): 328-337.
– Steffen Angenendt, S., Engler, M., und Schneider, J. (2013). Europäische Flüchtlingspolitik. Wege zu einer fairen Lastenteilung. Berlin: Sachverständigenrat deutscher Stiftungen für Integration und Migration (SVR) Mercator.
– Piguet, E. (2014). «Ewropa ta ‘solidarjetà!» ? Pour une répartition équitable des responsabilités. Terra Cognita: Revue suisse de l’intégration et de la migration, 25: 46-50.
Statistical data:
– Eurostat: Asylum applicants / Population / GDP / Unemployment (all countries except Switzerland)
– OCDE: Unemployment rate (only Switzerland)
– World Bank: Surface area
This is the translated version of the original blog post in French from 14 March 2019.

What would be a fair distribution of refugees in Europe? | Migration-Mobility Indicators 22.04.2020
[…] Cognita: Revue suisse de l’intégration et de la migration 25, 46-50. Piguet, Etienne (2019). Tool for a More Equitable Distribution of Refugees in Europe. Neuchâtel: nccr – on the move blog. EUROSTAT: Asylum applicants / Population / GDP / […]